
Amazon Vendor Analytics Tutorial: A step-by-step guide to help you understand Analytics & Reports.

Getting to grips with the nuances of Vendor Central is no easy feat. It’s a complex platform with hyper-specific data points and terminology. Failing to understand Amazon vendor central reports will negatively impact your brand’s relationship with Amazon, the integrity of your catalog on the marketplace, as well as your channel profitability, market share, and revenue.
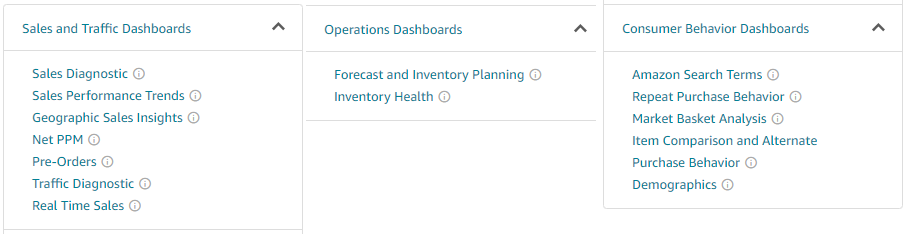
The Amazon Brand Analytics dashboard is divided into three main sections:
Amazon Vendor Central Analytics: A Brief Overview
All the data you need to know about your Amazon vendor listing is right in front of you. However, AWS lacks a user-friendly interface, making navigation and analytics very difficult. This is thanks to the fact that AWS was first developed as a platform for internal use only.
With little to no training, Vendor Central can be frustratingly complicated – even for experienced eCommerce professionals. This is why we’ve compiled this resource to help you navigate Vendor Central’s back end like a pro.
ARA (Amazon Retail Analytics) Basic
Amazon has recently announced that several new features will be added to the free version of its Amazon Retail Analytics (ARA) tool. This is great news for brands who have previously relied on basic ARA, as it offers a much more robust feature set.
Basic Amazon Retail Analytics subscribers will now be granted access to the following:
- Historical sales data (up to 90 days)
- Search terms reports
- Brand loyalty reports
- Product performance reports
ARA (Amazon Retail Analytics) Premium
Amazon Retail Analytics Premium is a suite of additional reports beyond what is available in Amazon Retail Analytics (ARA) Basic. ARA Premium includes all the functionality of ARA Basic, as well as new features that give you greater visibility into historical and real-time sales performance.
As a prerequisite to keeping this reporting, a vendor must enroll in Brand Registry or they will lose access.
Highlights of Amazon Vendor Central Reports include:
- Past 90 days of data updated daily
- Customizable date range, with up to 12 months of data
- Filters by categories, brands, ASINs, item condition and more
- Ability to download reports into Excel or CSV formats for further analysis
- Reports on top-selling items by category or brand
- Reports on items in your catalog that are included in Amazon’s Top 100 Most Wished For & Gifted lists
- Reports that show which products have seen an increase in sales velocity over the last 30 days and which have decreased over the same time period
Amazon Vendor Central Reports
Amazon Analytics for vender central provides you with access to more than 15 high-level reports with an ability to deep-dive specific parts to expand the number of reports to above 30.
The Analytics reports cover in-depth sales, marketing, operations, customer behavior and enhanced trends that enable you to make more informed business decisions.
This will help you to optimize your retail strategy, assess your market share, identify new opportunities, and monitor factors that impact sales. Data is generally available in Amazon store analytics within 72 hours of the close of a given period.
The key features of the Vendor Central Analytics are:
- Pre-Orders Data: Measure your pre-order sales by product and state to get early signals of demand.
- Search Terms: See how customers (in aggregate) are finding your products and other products on Amazon, including each product's relative search popularity, click share, and conversion share.
- Alternate Purchase: View which products Amazon customers (in aggregate) most frequently purchased on the same day they viewed your products but did not purchase.
- Market Basket Analysis: Learn what other products are purchased along with your products.
You can find Brand Analytics under the Reports tab in Vendor Central. This feature is only available if you own your brand, and are responsible for selling the brand on Amazon. You must also be internal to the brand and not a third party company supporting the brand.
If you don't have access to Brand Analytics in your Vendor Central account then you have not been identified as a vendor and brand owner who meets the Brand Registry criteria.
a. To be sure, check with your Amazon Vendor Central account manager (you may not have one)
b. If you are not registered, the first step as a brand owner is to apply for the Brand Registry.
Sales and Traffic (Amazon Vendor Central)
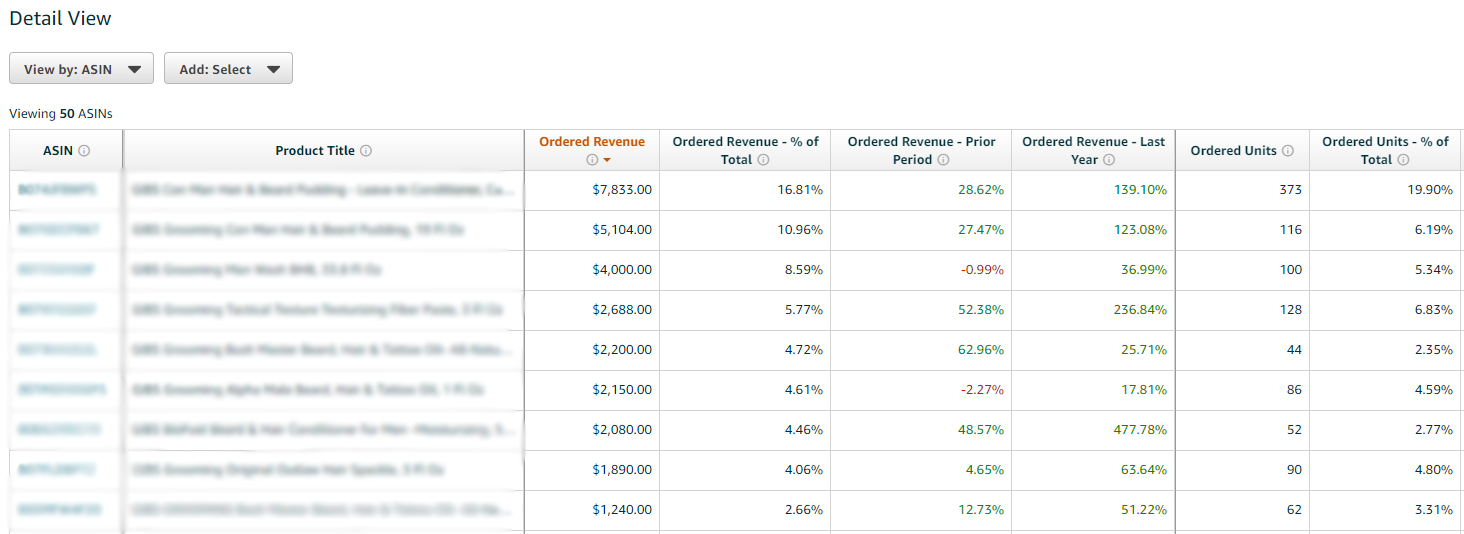
Sales Diagnostic Report
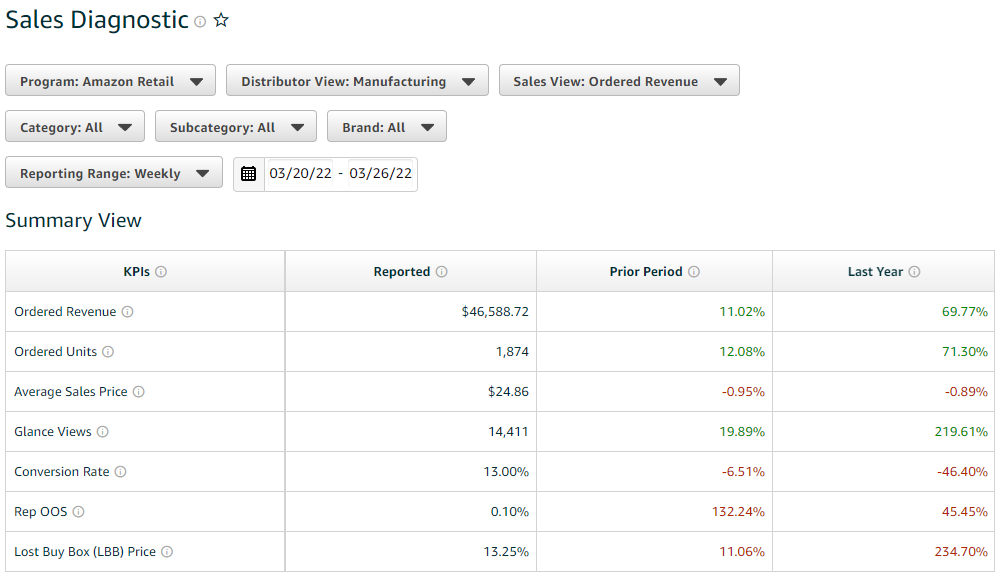
By using the Sales Diagnostic report, you can quickly identify which factors contributed to sales performance. The report shows the dollar amount and percentage change in sales for the selected period.
If you’re monitoring real time sales data, you can use this report to understand what is contributing to sales performance. The following example shows a summary of the year-to-date data for a specific product.
The first column shows the percentage change of each item compared with the same period last year. The second column shows the dollar amount change for each item compared with the same period (week, month, quarter or year).
Sales Performance Trends Report
This report in the amazon vendor central reports provides a quick view of your sales performance, trends over time and sell through rate.
Use the Date Range selector to select the period of time you'd like to view your sales performance for. Note that your data will be available as early as Jan 1, 2018.
- The Sales Performance Trends card provides insight into the following key performance indicators (KPIs):
- Sales revenue: Your total sales revenue for the selected time period.
- Units sold: The total number of units sold for the selected time period.
Average selling price: The average selling price of all products sold during the selected time period. You can use this metric to compare how much revenue is being generated on average per product, helping you identify which products are driving revenue growth.
Glance views: The total number of glance views on all your products during the selected time period.
Glance views represent an important first step in the buying journey and may indicate a customer's interest in a product, but there's no guarantee that a glance view will result in a purchase. Use this metric to track general interest in your products and compare it to other KPIs such as conversion rate change, which indicates whether or not that interest is translating into sales or not.
Geographic Sales Insights Report
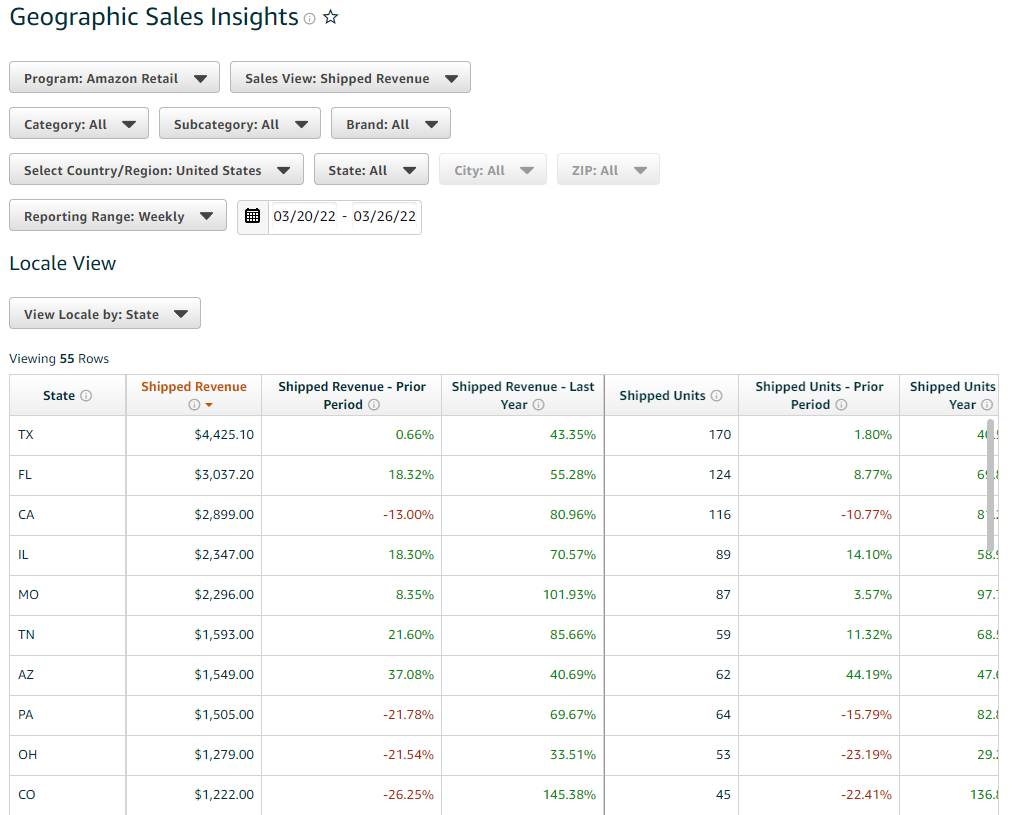
The report gives information on the state, city and ZIP where your products got shipped.
Geographic Sales Insights is available in Seller Central's Reports section.
Choose a date range. You can select the last 30 days or create a custom date range of up to 3 months (90 days).
You can filter the results by sales channel and select to see either all U.S. orders or orders from a specific State, City or Zip code.
You can sort the results by clicking on one of the headers for "State," "City," "Zip Code," "Orders" and "Sales."
Net PPM (Net Pure Product Margin) Report
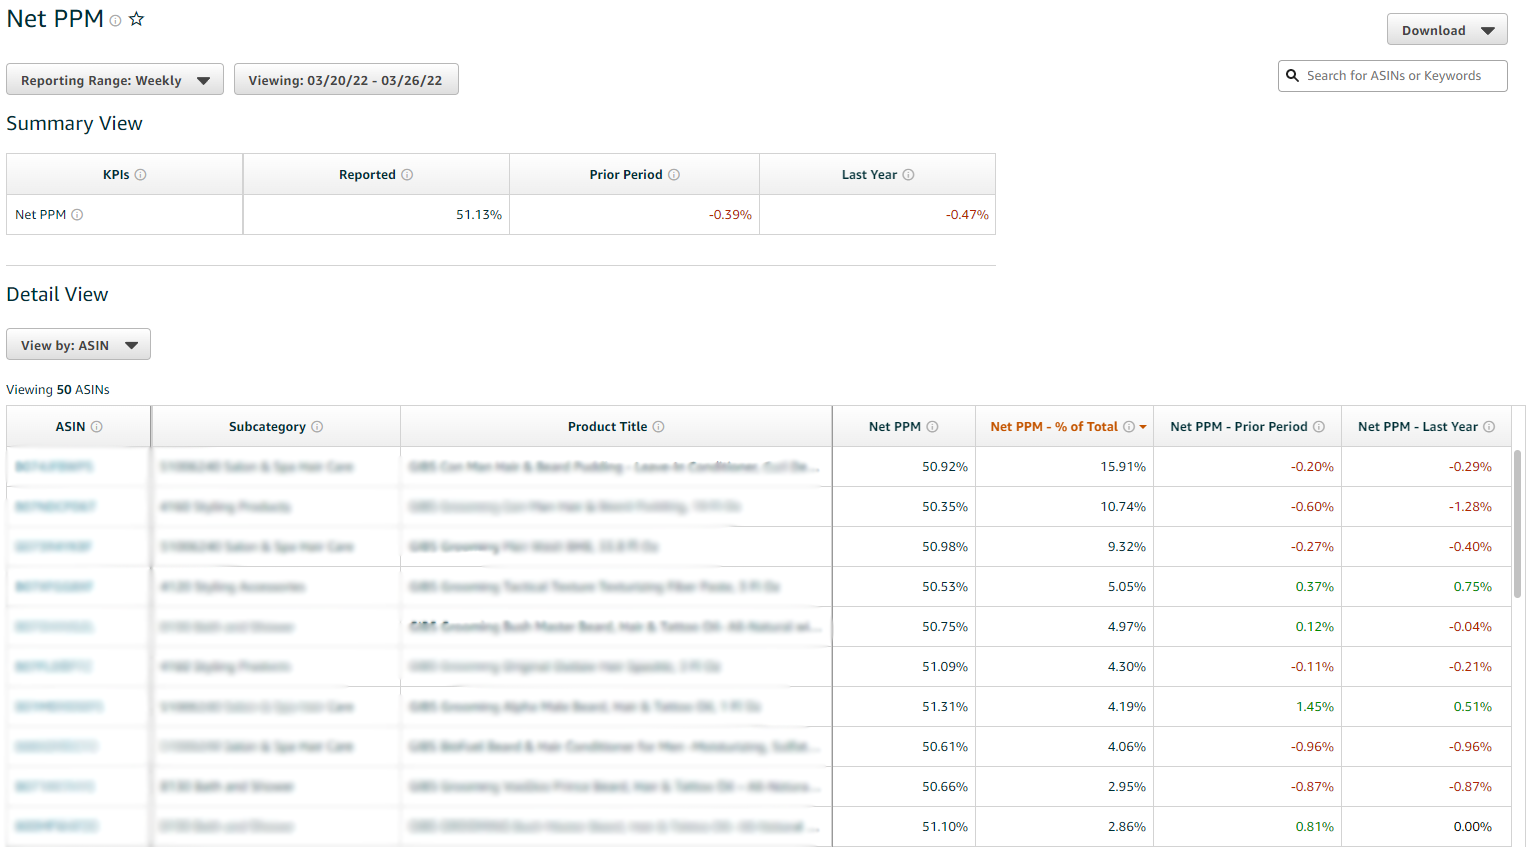
With just a few clicks, the new Net PPM report will show you your top products based on gross revenue and net profit. This is a great tool for identifying which products are really working for you and which you might want to consider re-evaluating.
The report is easy to read and gives you product information at a glance including:
- Net PPM (Net Pure Product Margin - margin after cost of goods sold and various agreed services such as damage allowance are deducted. Note: any sales discounts are not factored in)
- Percentage of Total
- Prior Period
- Previous Year
Pre-Orders Report
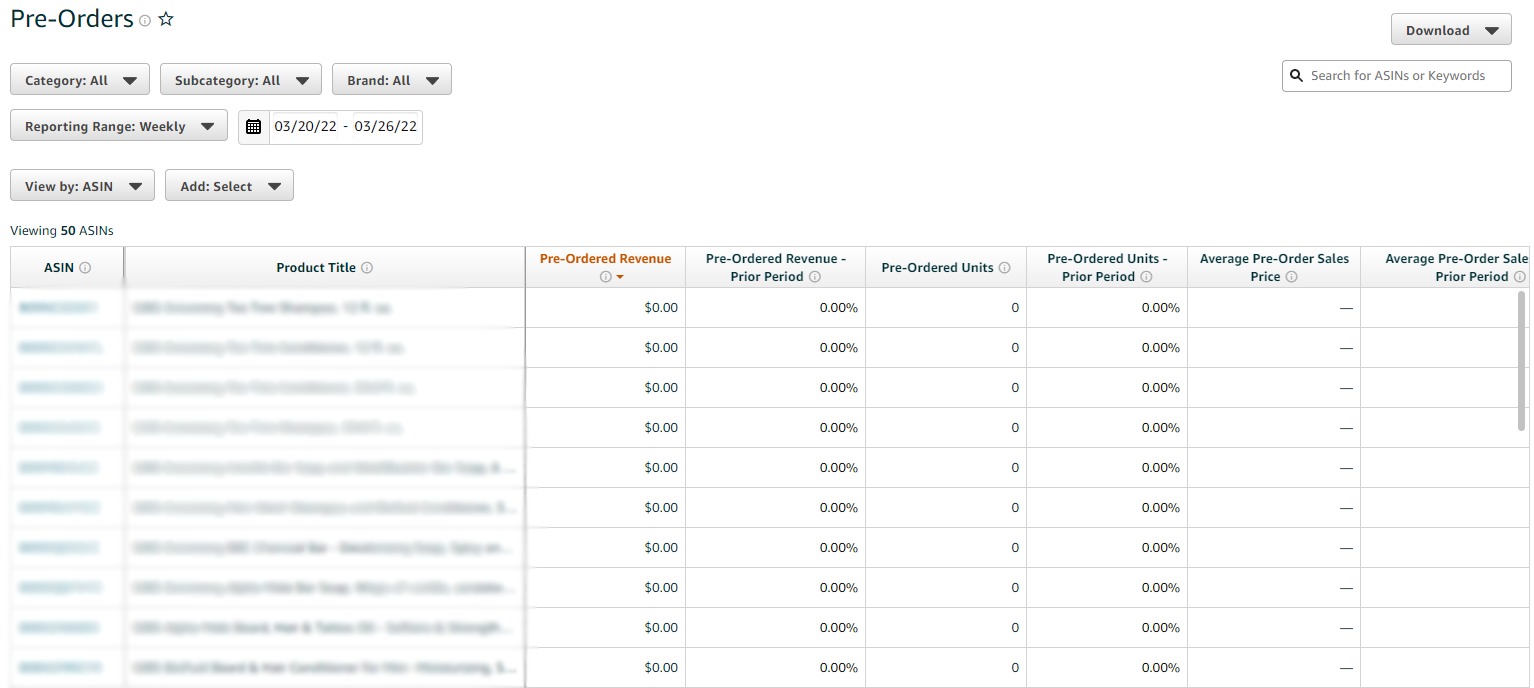
Pre-orders can be a great way to kick up sales weeks or months before your new product hits the shelves. But they also can be a trap, sucking up marketing resources and inventory space that could be used on more productive promotions. Effectively manage new product releases by closely monitoring pre-order performance.
Traffic Diagnostic Report
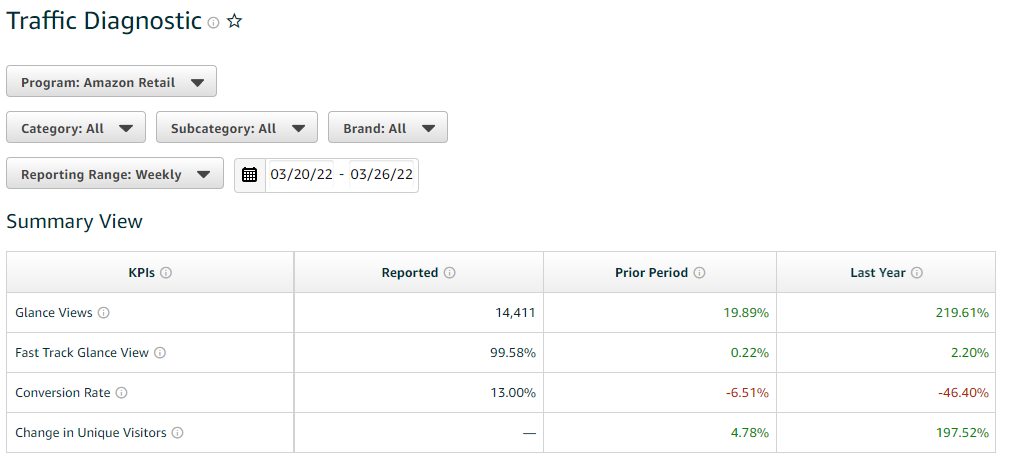
This dashboard provides a quick, at-a-glance view of changes in performance and industry benchmarking for your brand's products on Amazon.com. It also offers a detailed view of your conversion metrics, so you can see where to focus your efforts. You can identify changes by comparing performance from the current period to the previous period or the same time last year.
Quickly identify changes in glance views and conversion by viewing prior period, previous year, and industry benchmark.
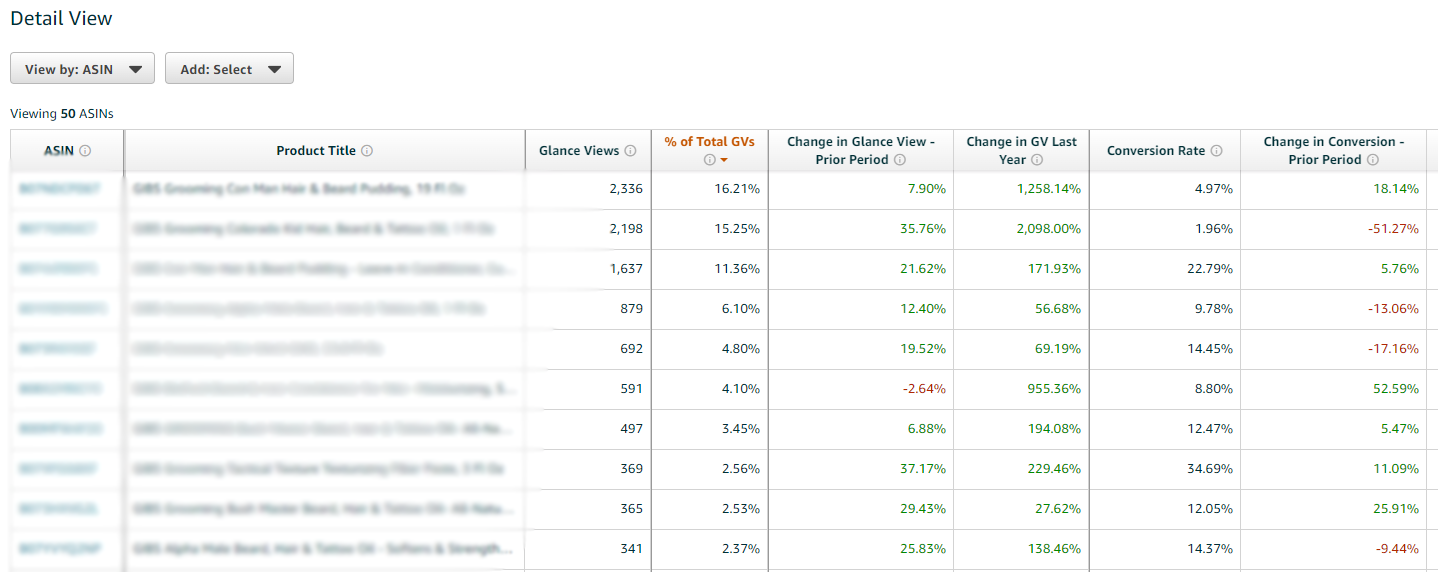
- Glance views help customers determine if your product is relevant to their search.
- Conversion helps customers decide whether to buy your product or move on to the next search result.
- Glance views and conversions are a key indicator of whether your ads are driving interest in your product.
- Glance view rate is the percentage of customers who view your product details after clicking on your ad.
- Conversion rate is the percentage of customers who buy your product after viewing the details page.
Real Time Sales Report
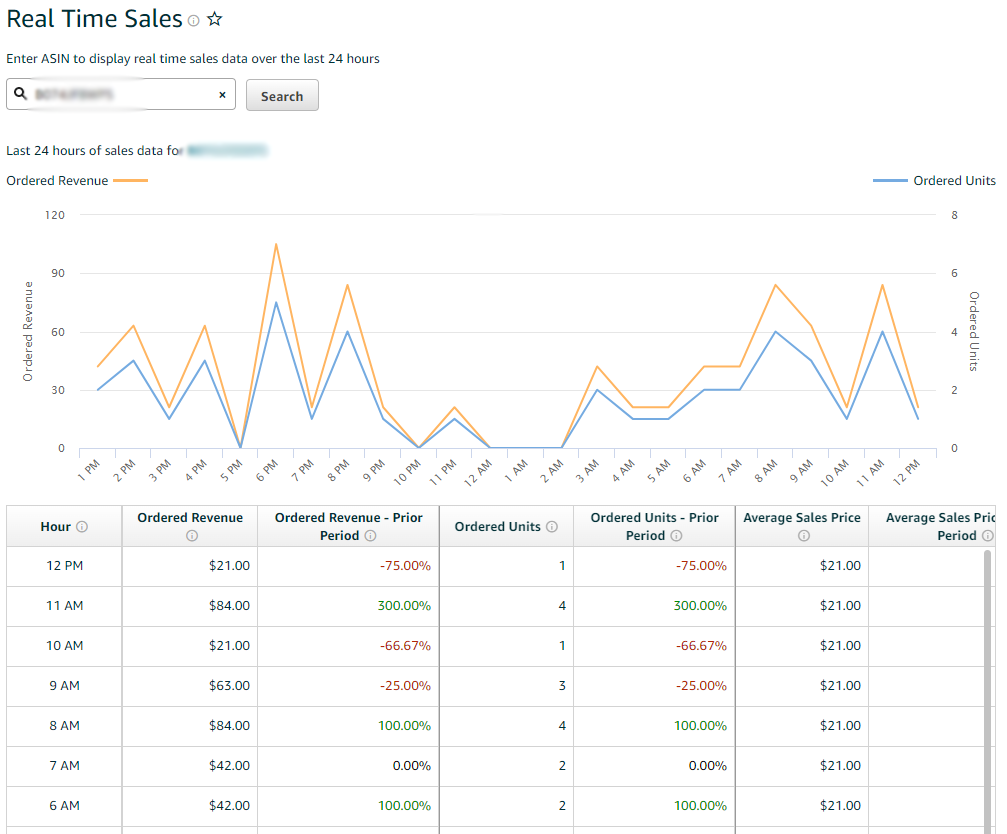
The Real Time Sales page displays real-time sales data for a specific ASIN over the last 24 hours. It also shows how the current day's sales compare to previous days to gauge Amazon sales performance trends.
Real Time Sales provides a snapshot of your product's sales over the last 24 hours. You can use this information to see how your product is performing and to make decisions about how you want to sell it.
By default, data is shown in UTC time. You can change the time zone that is displayed on the page by clicking on the time zone settings link above the graph.
Operations Dashboard (Vendor Central)
Forecast and Inventory Planning Report
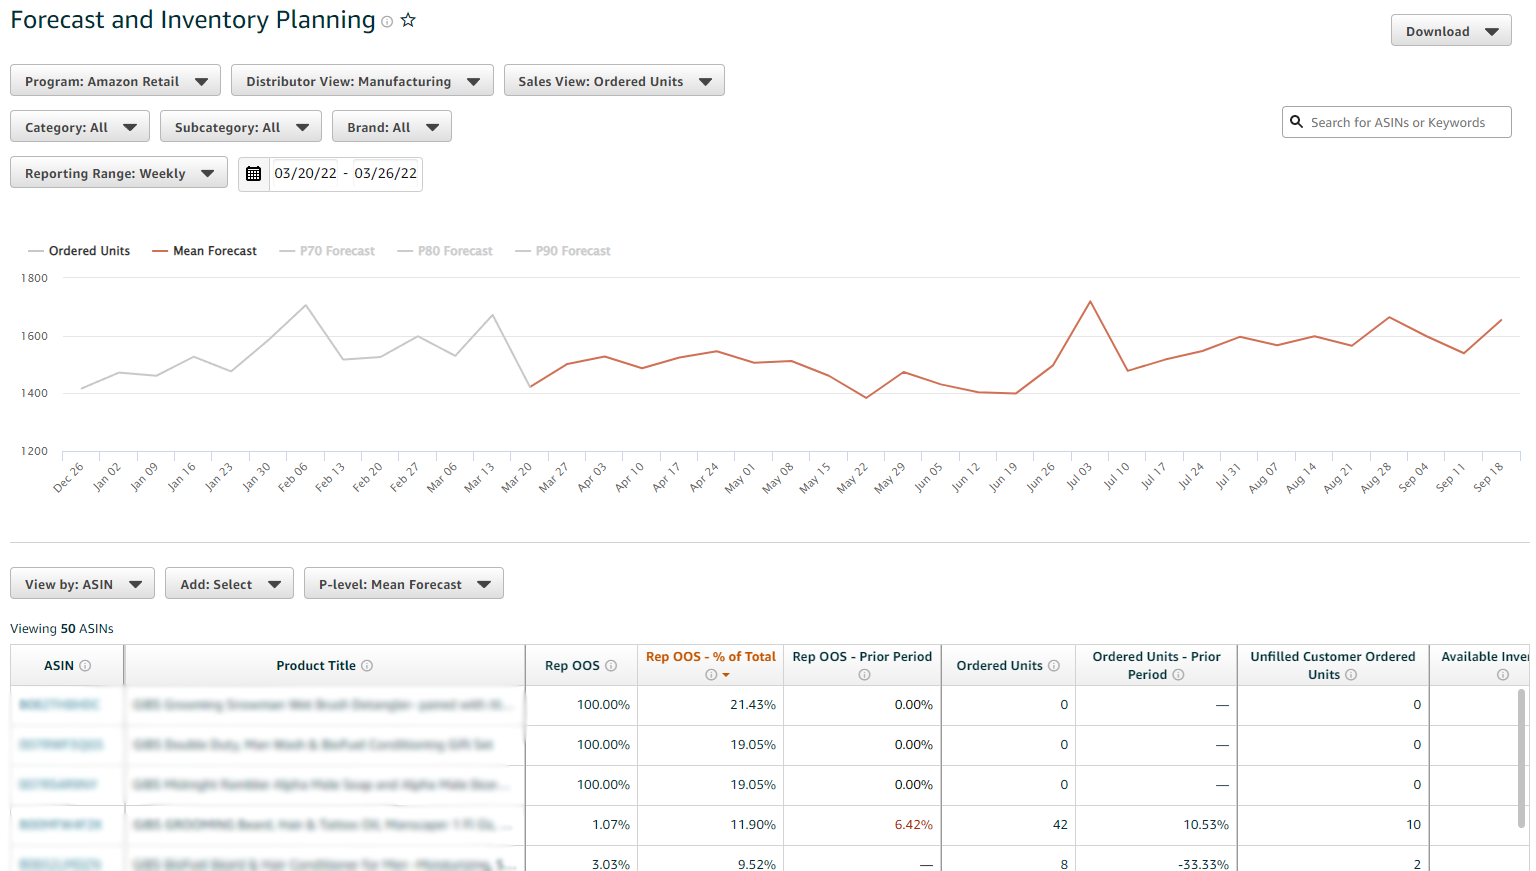
Prevent replenishable out of stock revenue losses with data-driven inventory planning that shows how much inventory Amazon will be ordering in the upcoming period. There are 4 types of forecast:
- Mean Forecast: Amazon’s best estimate of customer demand
- P70 Forecast: Means there is a 70% chance Amazon will purchase the level of demand indicated or less and a 30% chance they will purchase more.
- P80 Forecast: Means there is a 80% chance Amazon will purchase the level of demand indicated or less and a 20% chance they will purchase more.
- P90 Forecast: Means there is a 90% chance Amazon will purchase the level of demand indicated or less and a 10% chance they will purchase more.
Inventory Health Report
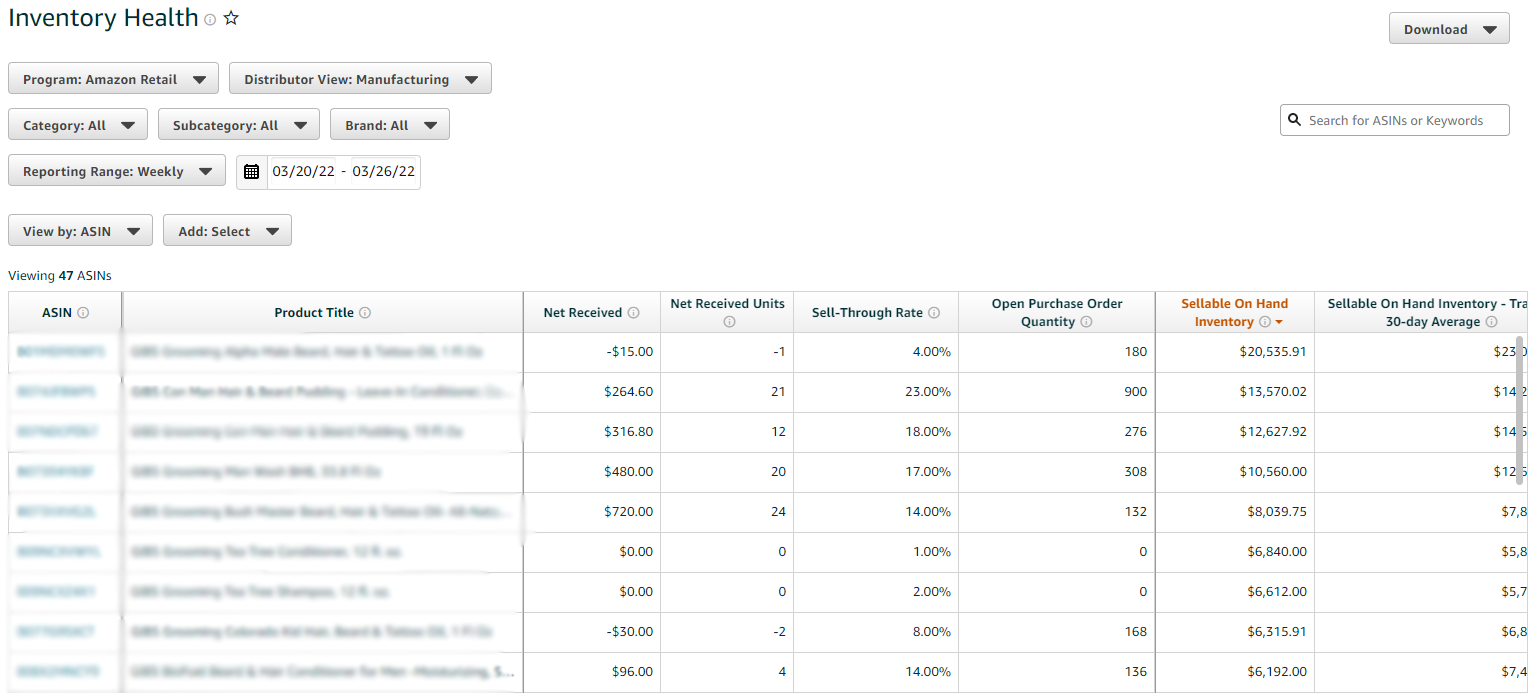
Monitor the inventory health of your products through weekly updates – this allows you to quickly identify and respond to unfavorable trends. The most important KPIs to analyze include Sell-Through Rate, Sellable On Hand Inventory and Open Purchase Order Quantity.
Sell Through Rate (STR) is the percentage of inventory sold over a given period of time relative to the total amount of inventory available for sale during that period. STR = Sold Units / Total Units Available for Sale
Sellable On Hand Inventory is the total number of units that can be sold on Amazon.com, including both inbound inventory and existing on-hand inventory in our fulfillment centers. Maintaining your inventory health through data driven inventory planning is vital to success on Amazon.
Open Purchase Order Quantity is the total number of units which are reserved for your active purchase orders from your suppliers but have not yet been received by our fulfillment centers.
Consumer Behavior Dashboard (Amazon Vendor Central)
Amazon Search Terms Report
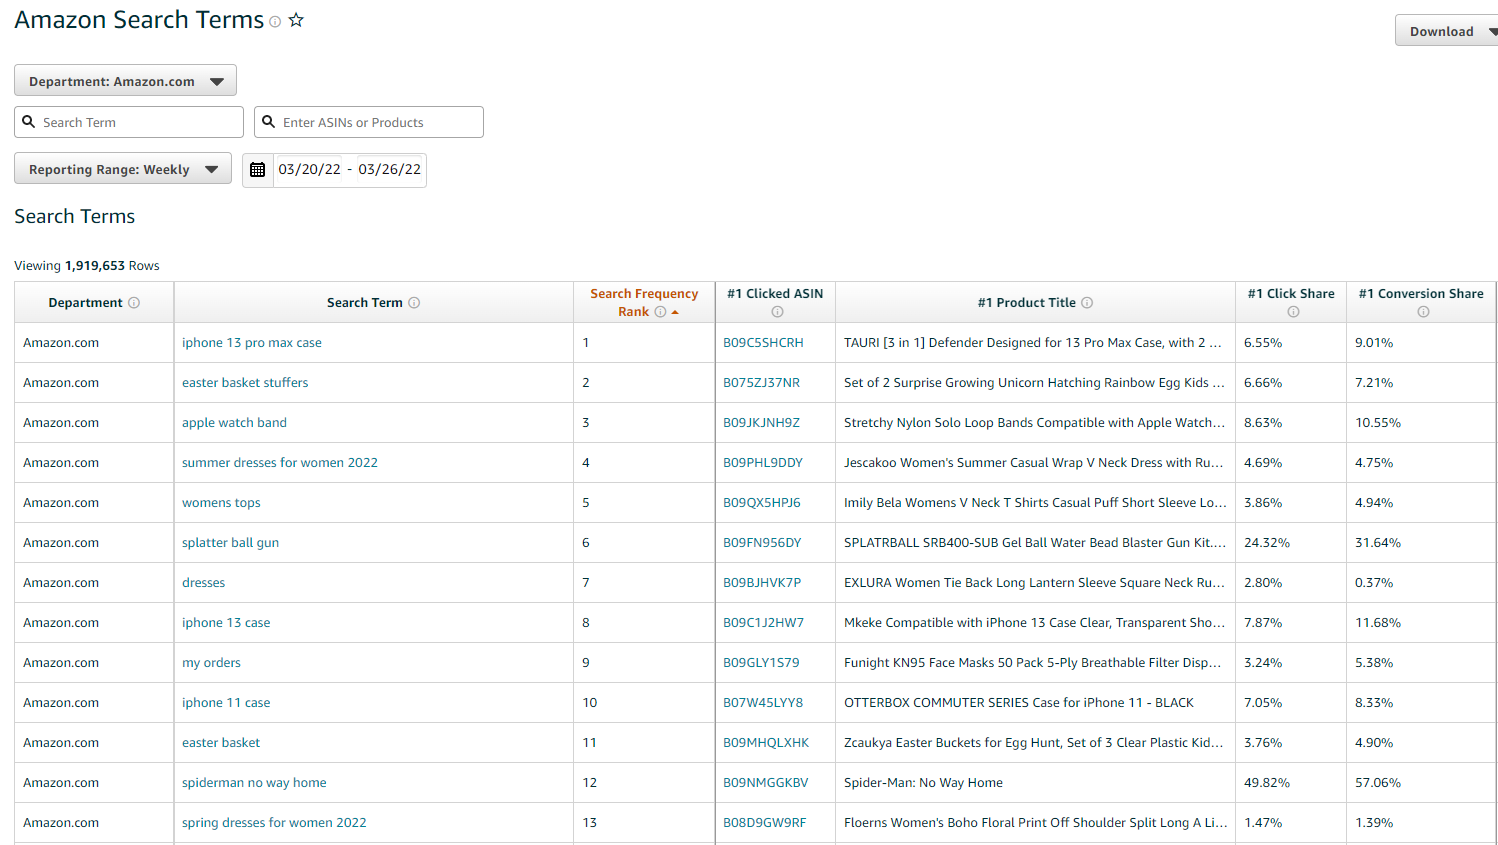
The Amazon analytics search terms dashboard gives you a window into the mind of your customers. Discover what products are winning the most clicks and conversions on strategic search terms. Assess the impact of your marketing campaigns, watch for seasonal trends, and identify opportunities to improve your own product page's visibility and conversion rate.
This dashboard is designed to help you understand where your product ranks and what it takes to climb that ladder. The keyword filter allows you to monitor specific keywords or keywords related to a specific product, category or brand.
You can also discover which keywords have high conversion rates but low sales volume, so you can focus on improving visibility for those keywords. By filtering for keywords with high conversion rates but low sales volume (in other words, low ranking), you can identify opportunities where small changes on your product page could lead to significant improvements in sales.
For example, if you want to sell more cases of wine online, you can leverage this tool by filtering by the keyword "wine." You'll discover that "wine bottle covers" has a 100% conversion rate but only one sale in the last 30 days. In comparison, "wine glasses" has only a 25% conversion rate with 516 sales over the 30-day period. This suggests that shoppers who
Repeat Purchase Behavior Report
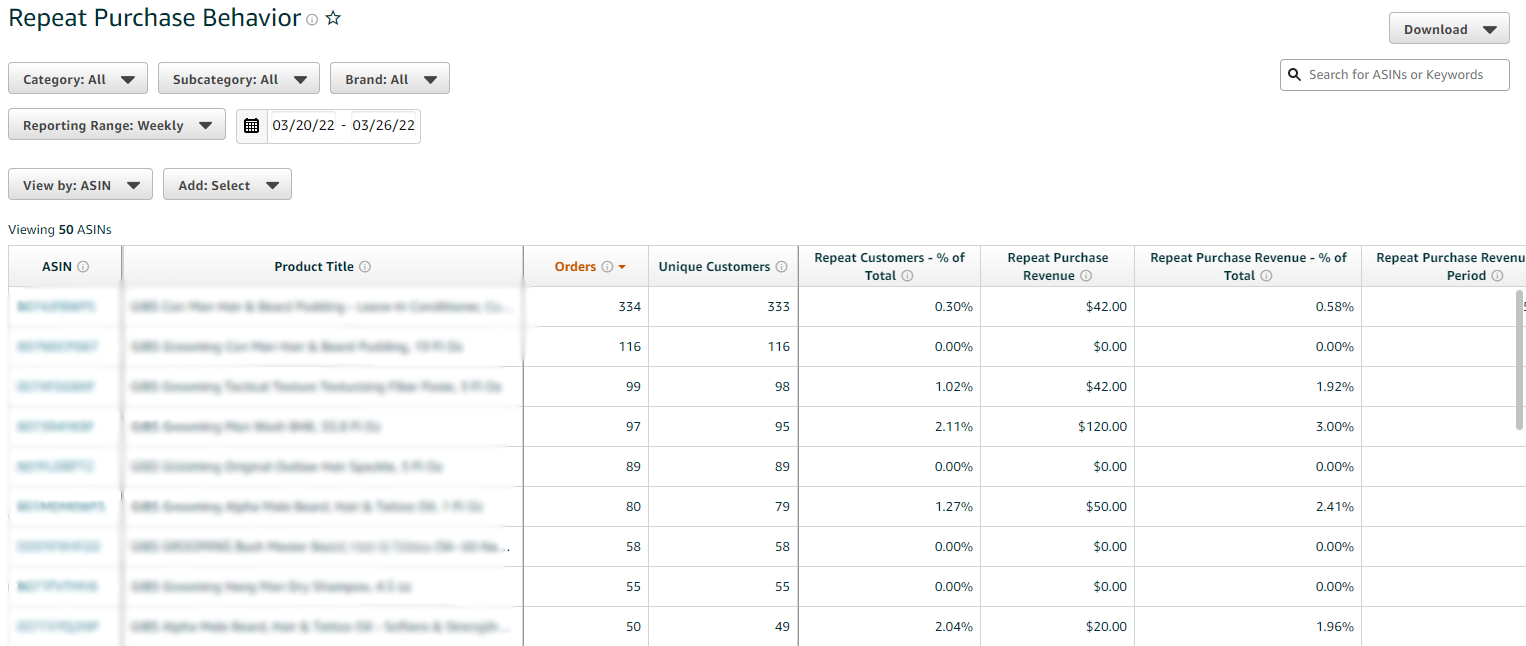
As a seller on Amazon, you can use the repeat purchase behavior analysis to gain insight into how customers are interacting with your products. This information can help you identify where to focus your marketing efforts so that you can optimize both repeat customers and new customer acquisition.
The repeat purchase behavior analysis displays the number of orders from unique customers compared to the number of orders from repeat customers. The report shows these metrics over time, segmented by country and product group.
An order is considered repeated if it follows an order by the same customer within a 90-day period. If a customer places another order more than 90 days later, that order is considered a first-time order. This calculation is based on the date when Amazon processes the payment for an order (the "order date") rather than when the customer places an order.
Market Basket Analysis Report
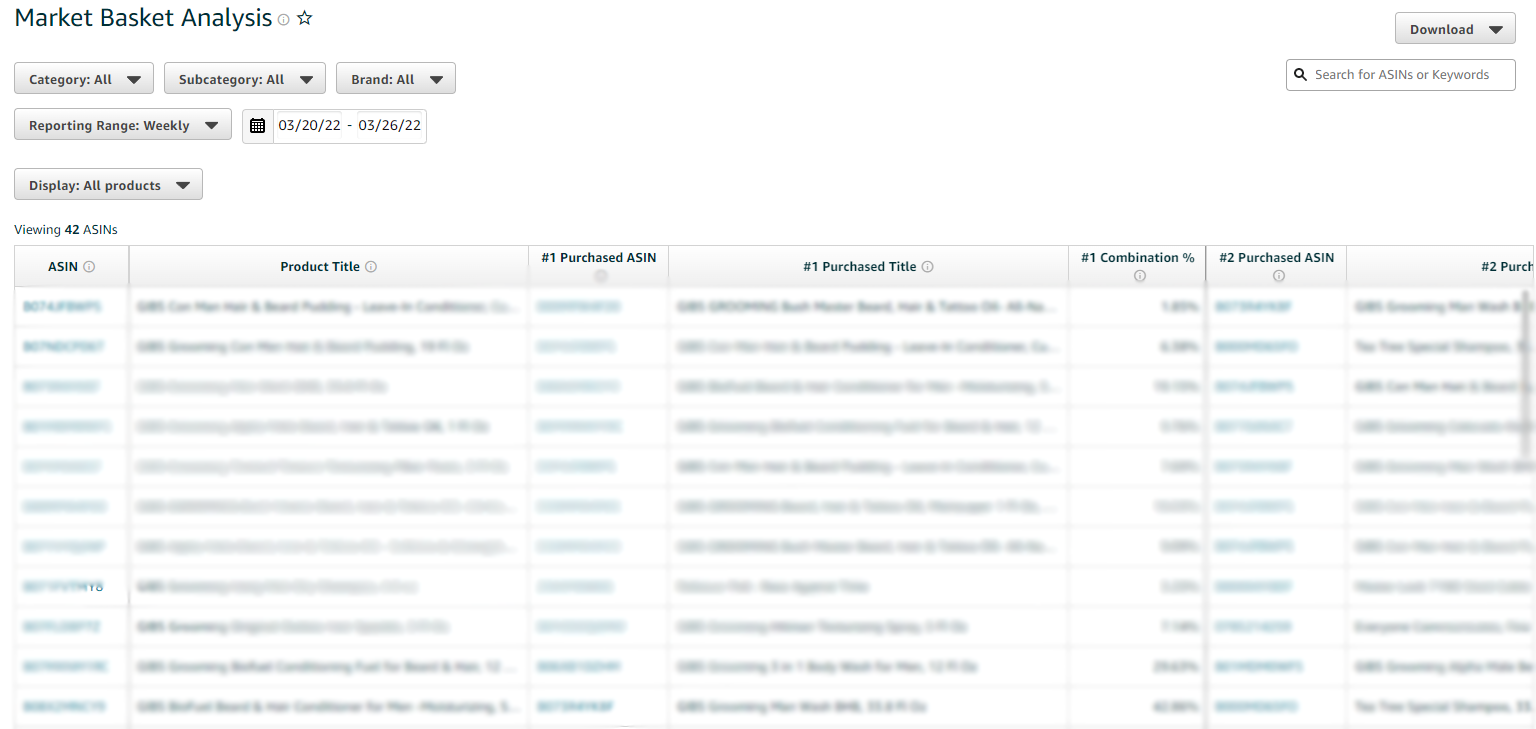
Identify cross-selling and bundling opportunities by gaining insight on products that are being purchased together by your customers.
Market Basket Analysis section gives you the ability to identify cross-selling and bundling opportunities by gaining insight on products that are being purchased together by your customers. The reports surface associations between your brands’ products and other products, helping you identify items that are frequently purchased together.
During the shopping process, customers typically check out multiple items in a single transaction. The basket analysis is a statistical method that helps you understand the associations between these products in order to optimize and enhance your marketing efforts.
By analyzing which products were purchased together and when, you can achieve a better understanding of what consumers want and can then potentially position new offerings to meet their needs. For example, you might find that your bike accessory is often purchased along with a specific bike helmet.
This information helps you dedicate resources more efficiently as well as create better promotions (e.g., bundling). Market basket analysis also gives you insight into which products are bought most frequently, which enables you to better staff customer service representatives to handle questions about high volume items.
Item Comparison and Alternate Purchase Behavior Report
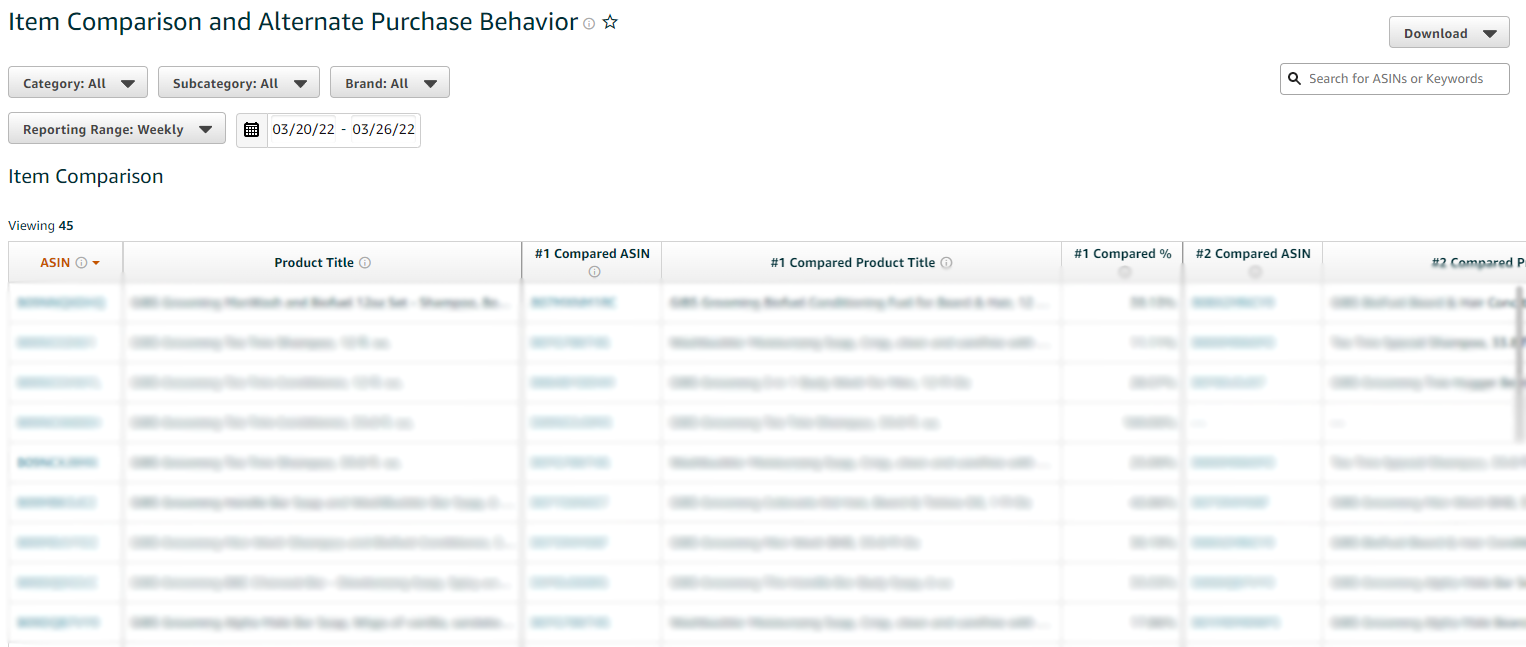
Update: From June 30, 2022, these amazon vendor central reports will no longer be available.
These two new reports that Amazon is rolling out to help sellers understand how customers are interacting with the products on their site. They’re similar in that they look at how customers move from one product to another, but they take different approaches:
Item comparison in the Amazon vendor central reports shows you how often your product is viewed alongside other products. Use this report to see if your products are frequently compared to others, or if there’s a competitor you should be keeping a close eye on.
Alternate purchase behavior looks at which products customers add to their cart after viewing yours, and which ones they actually buy. Use this report to see if there are other products you should be considering selling, or if the items that you sell have very different add-to-cart and purchase rates.
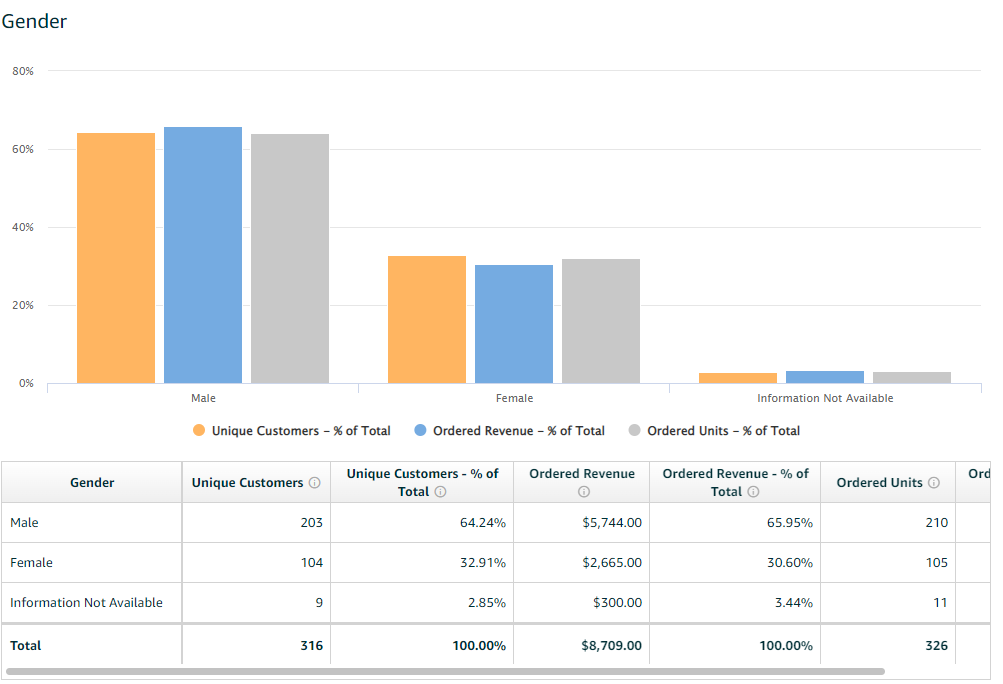
Demographics Report
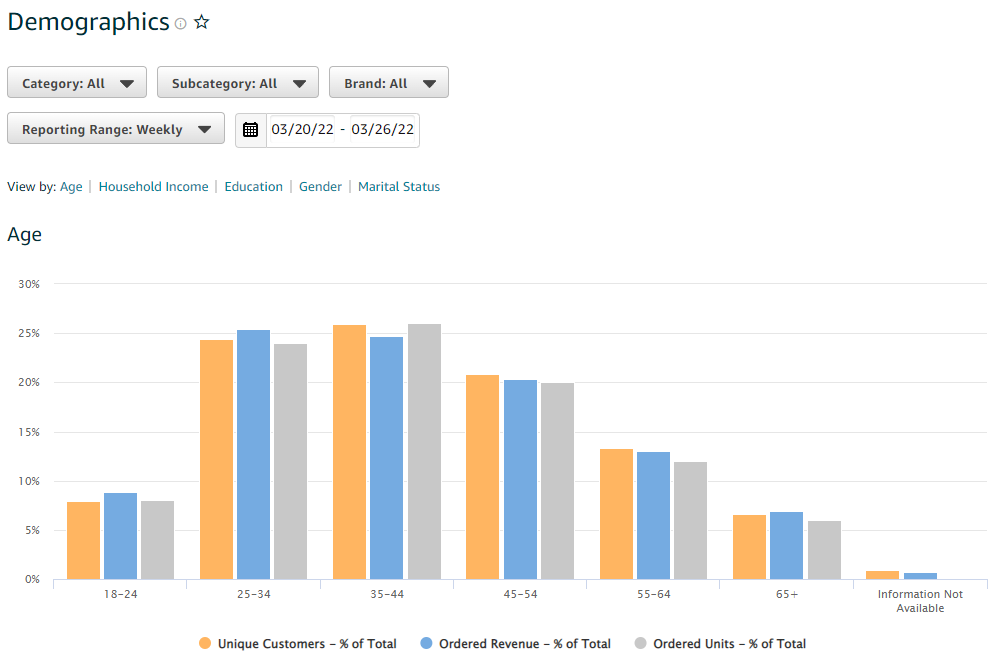
The Demographics report enables brands to view the types of customers that have purchased their brand's products on Amazon. Data from the Demographics report can help brands connect with their target audience more effectively or identify customization opportunities.
Demographic data is collected through Amazon Retail and based on customer orders for your brand's products. For example, if someone purchases a product from your brand, but doesn't create an account, we use information such as shipping address to assign an age, gender, and location-based demographic to that order. We then extrapolate out based on the total number of orders to make predictions about your target audience.
Data points include Age, Household Income, Education, Gender and Marital Status. The data may not be available for some brands due to small sample sizes or because certain demographics are not present in the brand's target audience.
Amazon Vendor Analytics: Frequently Asked Questions
What is the Best Amazon Brand Analytics Tools?
If you are looking for Amazon Vendor Reporting software to replace Amazon Brand Analytics or ARA Premium - you need to check out the beBOLD Global Vendor Reporting Analytics software. beBOLD iis more powerful version of the Amazon analytics tools using in Amazon com vendor central.
What is Amazon Retail Analytics?
Amazon Brand Analytics (formerly known as Amazon Retail Analytics or ARA) Premium for Vendor Central is an add-on suite of additional reports which Vendors have access to through Vendor Central. These reports provide information regarding: Customer Behavior. Sales. Geographic Performance.
What happened to the Amazon Vendor Sales Performance Trends Report?
Amazon removed this report in April 2022 and we all users were told to use Sales Diagnostic report found Brand Analytics > Sales and Traffic Dashboards > Sales Diagnostic.
Where did Geographic Sales Insights Report in Vendor Brand Analytics go?
Amazon removed this report in April 2022 without any future plans of bringing back that report from the date this blog article was published.
Where did Item Comparison & Alternate Purchase Behavior Dashboard go?
Amazon removed Item Comparison & Alternate Purchase Behavior Dashboard in Amazon Brand Analytics in June 2022 without any future plans of bringing back that report from the date this blog article was published.
Attention: BeBOLD helps beauty brands grow on markets like Amazon and Walmart by leveraging its expertise in the digital beauty space.
Interest: You say you want to expand your brand's footprint in new markets, but you don't have time to do it alone? Let BeBOLD help you. If you're looking for a partner who has 60 years of experience in the beauty industry, look no further.
Desire: If you're looking for more information on what BeBOLD can do for your brand, contact us now. We're ready to chat!
Action: Talk to us today to learn more about how we can help your brand grow.


Comments