
Key Summary
- 📢 Amazon has rolled out the new Amazon Retail Analytics (ARA) dashboards in Vendor Central, bringing simplified, data-rich tools for Sales, Traffic, Forecasting, Inventory, Net PPM, and Catalog reporting.
- You’ll spot announcements in your Brand Analytics dashboards soon, guiding you toward the new ARA experience for a smoother transition.
- 🧪 For now, both the new and existing dashboards will run in parallel while Amazon gathers feedback and enhances ARA features.
- ARA offers two levels: Basic, which includes foundational insights like product sales and customer demographics, and Premium, which adds advanced features like predictive analytics and marketing attribution.
- ✨ Retail Analytics vs. Brand Analytics: Retail focuses on sales ops and profitability, while Brand zeroes in on shopper behavior and brand engagement.
- Benefits of ARA include smarter decision-making, optimized inventory, better forecasting, and automation that boosts operational efficiency.
- To use ARA, log in to Seller Central → Reports → explore dashboards → analyze KPIs → customize reports → set alerts. 🔔
- 🛠️ Missing or mismatched ASINs in reports? It’s likely due to mapping, sourcing views, or admin rights—contact your retail partner if issues persist.
- Want to dive deeper? Check the Amazon Retail Analytics metric glossary, explore all dashboards, and use the ARA feedback tab to share your thoughts. 💬
As part of Amazon's continual efforts to improve reporting products, they have announced the launch of the new Amazon Retail Analytics (ARA) on Vendor Central. ARA prioritizes data integrity and simplifies sales and operational reporting with a focus on critical data through new Sales, Traffic, Net PPM, Forecasting, Inventory, and Catalog dashboards. When used in tandem with Amazon Brand Analytics in Vendor Central, vendors can access a broader range of insights—combining operational performance with detailed customer behavior and search term analytics for a more complete strategic view.

If you have not encountered them already, you will soon find announcements on your Amazon Brand Analytics dashboards that will direct you to the new ARA dashboards.
Brand Analytics will maintain the current report dashboards in parallel with the new dashboards as we collect and assess feedback on performance and usability. You will continue to have access to the current reports while we refine and develop functionality in ARA.
For more information, go to Amazon Retail Analytics dashboards.
We hope you find the ARA dashboards useful. You can use the feedback tab on the lower left side of the ARA dashboard page to send us any thoughts and feedback you might have.
For a glossary of metrics included in the Amazon Retail Analytics (ARA) dashboards, go to the Amazon Retail Analytics metric glossary.
In this blog, we will cover the following topics:
- What is Amazon Retail Analytics?
- What is the Difference Between Retail and Brand Analytics?
- What are Some of the Benefits of Amazon Retail Analytics?
- How to use ARA and List of New Changes?
- Which Information is Provided on the General Retail Analytics Dashboard?
- Which Information is Provided on the Retail Analytics Forecasting Dashboard?
- Which Information is Provided on the Retail Analytics Inventory Dashboard?
- Which Information is Provided on the Net PPM Dashboard?
- Which Information is Provided on the Retail Analytics Sales Dashboard?
- Which Information is Provided on the Retail Analytics Traffic Dashboard?
- Which Information is Provided on the Retail Analytics Catalog Dashboard?
- Need Help with Understanding Amazon Retail Analytics? Connect with Us at Be Bold Digital Today!
- Conclusion
- Vendor Retail Analytics FAQs
What is Amazon Retail Analytics?
Amazon Retail Analytics is a powerful tool that provides sellers with valuable insights into their sales performance on Amazon. It offers a comprehensive suite of metrics and reports that can help you understand customer behavior, product performance, and market trends. When used alongside Amazon Brand Analytics in Vendor Central, you gain even deeper visibility into shopper search behavior and competitive positioning—allowing you to make informed decisions to optimize your sales strategy and drive growth.
ARA Basic Vs. ARA Premium
Amazon Retail Analytics (ARA) Basic and ARA Premium are two subscription levels Amazon offers for sellers to access detailed sales data and insights. While both plans provide valuable information, they differ in terms of the level of detail and features available.
ARA Basic offers a foundational level of analytics, providing essential metrics such as:
- Product sales: Total units sold, revenue generated, and conversion rates.
- Customer demographics: Information about your customer base, including age, gender, and location.
- Sales performance: Overall sales trends, seasonal patterns, and peak sales periods.
ARA Premium provides a more comprehensive set of features, including:
- Advanced product analytics: Detailed information on product performance, including search terms used, customer reviews, and product recommendations.
- Customer segmentation: The ability to segment your customer base based on various criteria, such as purchase history, demographics, and behavior.
- Marketing attribution: Insights into the effectiveness of your marketing campaigns, including which channels are driving the most sales.
- Predictive analytics: Forecasting tools to help you anticipate future amazon market trends and optimize your inventory management.
What is the Difference Between Retail and Brand Analytics?
Retail Analytics and Brand Analytics are both valuable tools for understanding your performance on Amazon, but they focus on different aspects of your business.
Retail Analytics provides insights into the commercial and operational performance of your vendor account. It focuses on metrics related to sales, inventory, traffic, forecasting, and net PPM (Profit Per Million). This data helps you understand the overall health of your business and identify areas for improvement.
Brand analytics for sales strategy focuses on shopper behavior related to your products and brand. It provides data insights into repeat purchase behavior, top search terms used by customers, and market basket analysis. This information helps you understand how customers interact with your brand and identify opportunities to improve your product offerings and marketing strategies.
What are Some of the Benefits of Amazon Retail Analytics (ARA)?
Amazon Retail Analytics (ARA) offers several benefits to sellers, including:
- Improved decision-making: ARA provides valuable insights into your sales performance, customer behavior, and market trends, enabling you to make data-driven decisions to optimize your business.
- Enhanced sales performance: By understanding customer preferences and identifying opportunities for growth, you can improve your product offerings, pricing strategies, and marketing campaigns to increase sales.
- Optimized inventory management: ARA helps you track inventory levels, forecast demand, and avoid stockouts or excess inventory, resulting in improved cost management and profitability.
- Enhanced brand visibility: By analyzing customer reviews and feedback, you can identify areas for improvement and enhance your brand reputation.
- Increased efficiency: ARA automates data collection and analysis, saving you time and effort.
- Competitive advantage: By leveraging the insights from ARA, you can gain a competitive edge over other sellers by making more informed decisions and optimizing your business operations.
How to Use Amazon Retail Analytics and List of New Changes?

Amazon Retail Analytics (ARA) is a powerful tool that provides sellers valuable insights into their sales performance. To effectively use ARA, follow these steps:
- Access ARA: Log in to your Seller Central account and navigate to the "Reports" section.
- Explore Dashboards: Familiarize yourself with the different dashboards available in ARA, such as Sales, Inventory, Traffic, Forecasting, Net PPM, and Brand Analytics.
- Analyze Metrics: Use the provided metrics to gain insights into your sales performance, customer behavior, and market trends.
- Create Custom Reports: Customize reports to focus on specific areas of interest and track key performance indicators (KPIs).
- Set Alerts: Set up alerts to be notified of significant changes in your sales performance or other important metrics.
List of New Changes in Amazon Retail Analytics
- New metrics: Amazon may introduce new metrics to provide more detailed information about your sales performance.
- Enhanced visualizations: ARA may improve its visualizations to make data easier to understand and interpret.
- Improved integration: Amazon may integrate ARA with other Seller Central tools or external platforms to streamline your workflow.
- Bug fixes and performance improvements: Amazon may address any issues or bugs in ARA and optimize its performance.
To stay updated on the latest changes to ARA, it's recommended to check the Amazon Seller Central Announcements or contact Amazon Seller Support. If you work with a team, consider giving Amazon Seller Central user permission to colleagues or partners so they can also monitor updates and access relevant data directly.
Managing advanced reporting, alerts, and analytics often raises resourcing questions—especially as data complexity grows—explore whether internal teams or external support make more sense in Should I Hire an In-House Amazon Team or Amazon Agency
Which Information is Provided on the General Retail Analytics Dashboard?
Missing ASINs in the analytics dashboard
This can be due to one or a combination of the following reasons:
- Distributor view: Ensure that you have selected the proper Distributor view selection. The Manufacturing view shows data for ASINs manufactured by you, regardless of who sourced the products to Amazon. The Sourcing view shows only the data of ASINs sourced directly from a vendor code in your vendor group. Misinterpreting these views can lead to Amazon product research mistakes by basing decisions on incomplete or misleading data.
- No data in time period: An ASIN must have data for at least one of the metrics in a given dashboard for the selected time period being viewed in order for it to appear in that dashboard. For example, an ASIN with inventory will appear in the Inventory dashboard but may not appear in the Sales dashboard if no sales occurred for that ASIN in the selected timeframe.
ASIN mapping: Vendor hierarchy and ASIN catalog attribute setup impact how ASINs are mapped to ARA reports. ASINs not properly mapped to ARA may appear to be “missing” from reports. Once the mapping is corrected, it may take up to 14 days to reflect in the dashboards. For troubleshooting help with data issues related to ASIN mapping, vendor hierarchy, or catalog attributes, reach out to your retail partner or open a Contact Us case.
Unowned ASINs in the retail analytics dashboard
This is likely due to an ASIN mapping issue. ASINs not properly mapped to ARA via proper vendor hierarchy, ASIN catalog attributes, and vendor group setup may cause an ASIN to inaccurately populate in ARA dashboards. For troubleshooting help with issues related to ASIN mapping, reach out to your retail partner or open a “Contact Us” case and request ASIN mapping assistance.
Data does not match the data surfaced by the vendor manager or account manager
There is ASIN-level data parity between ARA and the internal tools used by your retail partners. For questions on reporting you receive from your retail teams, reach out to your retail partner or open a “Contact Us” case.
Only some users see a particular dashboard, while others can’t
Users who are not administrators must have the "Financial Reports" task-based role enabled in order to access the Inventory dashboard. Admins will already have all rights enabled by default. Only an admin can enable or disable a non-admin’s rights.
Which Information is Provided on the Retail Analytics Forecasting Dashboard?
The Forecasting dashboard lets you identify the customer demand for your products for production and inventory planning purposes.
The Forecasting dashboard lets you identify the customer demand for your products for production and inventory planning purposes.
Critical KPIs to review:
|
KPI |
Definition |
|
Mean Forecast |
The average value predicted by your forecasting model. |
|
P70 Forecast |
The value below which 70% of the forecasted values fall. |
|
P80 Forecast |
The value below which 80% of the forecasted values fall. |
|
P90 Forecast |
The value below which 90% of the forecasted values fall. |
Meaning of the different P-levels
The forecasting system produces forecasts for an ASIN at various confidence levels, or “Critical Ratios” (CR). If you are setting a CR of 80, a.k.a. "P80," it means there is an 80% probability that the ASIN will be in stock for the buying horizon. A higher CR or P-level means more buffer stock.
Vendor purchase orders don’t align with the unit forecast in the Forecasting dashboard
The forecast report provides a forecast for unconstrained customer demand, which is not a promise of purchase orders. If there are already on-hand or on-order units available to cover customer demand, for example, this would be accounted for when the system issues purchase orders.
Which Information is Provided on the Retail Analytics Inventory Dashboard?
The Inventory dashboard lets you monitor the health of your product inventory through weekly updates. You can quickly identify and respond to unfavorable trends.
Critical KPIs to review:
|
KPI |
Definition |
|
Sourceable Product OOS |
The quantity of products that are currently out of stock but can be replenished from existing sources. |
|
Vendor Confirmation Rate |
The percentage of purchase orders that have been confirmed by vendors. |
|
Net Received Units |
The total number of units received from vendors, minus any returns or damaged goods. |
|
Open Purchase Order Quantity |
The total quantity of products that have been ordered from vendors but not yet received. |
|
Sellable On-Hand Inventory |
The quantity of products that are available for sale and in good condition. |
|
Sell-Through Rate |
The percentage of inventory that is sold within a specific period. |
|
Unhealthy Inventory |
Inventory that is slow-moving, obsolete, or damaged. |
Unable to see inventory metrics at the daily grain
Not all metrics included in the Inventory dashboard are available at the daily granularity, so the option has been removed.
Out-of-stock (OOS) metric is not replenishable OOS (Rep OOS)
ARA surfaces Procurable product OOS (ROOS). While Rep OOS considers only replenishable ASINs, ROOS considers procurable ASINs. Since the ASIN cohort is larger for ROOS vs. Rep OOS, in most cases, ROOS will be a lower percentage than Rep OOS.
I can’t see ROOS or unfilled customer order units in the Sourcing view
This is expected behavior, as the data from ROOS and unfilled customer order units are only available for manufacturing vendors. This is ASIN-level data that cannot be attributed to a specific vendor.
Viewing Amazon Fresh (F3) sales
Access to Amazon Fresh views must be enabled by your internal retail partner.
Which Information is Provided on the Net PPM Dashboard?
The Net PPM dashboard lets you identify which products are driving profitability up or down by analyzing the Net Pure Product Margin (Net PPM). Net PPM measures product profitability after the cost of goods, vendor funding, and sales discounts are taken into account.
Critical KPIs to review:
|
KPI |
Definition |
|
Net PPM |
It is a key performance indicator (KPI) used in retail and e-commerce to measure the profitability of a product or category. Net PPM = (Net Profit / Net Sales) * 1,000,000 |
Unable to see the Net PPM dashboard
The Net PPM dashboard is typically only displayed to manufacturers. Reach out to your retail partners or open a “Contact Us” case if you believe you should have access to the Net PPM dashboard.
Warehouse Deals sales are not included in the Net PPM metric
Brand Analytics (including ARA) does not include Warehouse Deals sales in its metrics. Since proceeds from Warehouse Deals sales are not collected by the vendor, we do not account for these transactions. The internal tools used by your retail partners may be inclusive of Warehouse Deals sales. For questions on whether Warehouse Deals sales are included in your internal metrics, reach out to your retail partner or open a “Contact Us” case.
Which Information is Provided on the Retail Analytics Sales Dashboard?
The Sales dashboard lets you quickly identify opportunities by determining what is contributing to sales performance.
Critical KPIs to review:
|
KPI |
Definition |
|
Ordered Revenue |
The total revenue generated from all orders placed by customers, regardless of whether they have been shipped or fulfilled. |
|
shipped revenue |
The total revenue generated from orders that have been shipped to customers. |
|
Dispatched or Shipped COGS |
The cost of goods sold associated with orders that have been shipped or dispatched. |
|
Customer Returns |
The number of orders that have been returned by customers. |
Unable to see the Manufacturing view for the Sales dashboard; only the Sourcing view
All vendors will have access to the Sourcing view of the sales report, which will show the sales data for ASINs (with a product cost) that have an offer from a vendor code listed in the vendor group. If the vendor is a manufacturer, they will have access to the Manufacturing view, which shows ASIN-level data for any ASIN manufactured by the vendor code designated as the manufacturing role in the vendor group. Enabling or disabling this view will be owned by retail stakeholders. Reach out to your retail partner if you believe you should have access to the Manufacturing view or open a “Contact Us” case.
Warehouse Deals sales are not included in sales metrics
Brand Analytics (including ARA) does not include Warehouse Deals sales in its metrics. The internal tools used by your retail partners may be inclusive of Warehouse Deals sales. For questions on whether Warehouse Deals sales are included in your internal metrics, reach out to your retail partners or open a “Contact Us” case.
Customer returns and free replacements are accounted for in shipped units and revenue
ARA accounts for customer returns and free replacements in shipped units and revenue.
The date that customer returns and cancellations are attributed to
Customer returns and cancellations are applied to ordered revenue based on the original date of the sale.
Seeing Amazon Business (B2B) and Amazon Fresh (F3) sales
Access to views of other Amazon Programs, such as B2B and F3, is enabled via vendor group rights. Reach out to your retail partner or open a “Contact Us” case if you believe you should have access to these views.
beBOLD Tip: If you’re already seeing spikes in your Customer Returns metrics and aren’t sure what they mean for your operations, consider reviewing What Is Amazon RMA to better understand how Amazon’s return authorization process affects your reporting and performance.
Which Information is Provided on the Amazon Retail Analytics Traffic Dashboard?
The Traffic dashboard lets you quickly identify changes in relevant traffic-related metrics.
Critical KPIs to review:
|
KPI |
Definition |
|
Glance Views |
It refers to the number of times a piece of content, such as an ad, article, or video, has been briefly viewed by a user. |
Unable to access the Traffic dashboard
If the vendor is a manufacturer, they will have access to the manufacturing view, which shows ASIN-level data, such as traffic, Net PPM, and forecasting, for any ASIN manufactured by the vendor code designated as the manufacturing role in the vendor group. Enabling or disabling this view will be owned by retail stakeholders. Reach out to your retail partners or open a “Contact Us” case if you believe you should have access.
Defining a glance view
Glance views (GVs) measure customer traffic and are defined by the number of views to the product detail page.
How glance views are calculated in Brand Analytics
In Brand Analytics reporting, GVs are calculated at the ASIN level and only when Retail is the featured seller (that is, has the featured offer on the product detail page). By exposing raw GVs when Retail is the featured seller, we provide vendors with the traffic data where Retail had the opportunity to convert a sale.
The glance view metric in Brand Analytics doesn’t match Advertising reports
Glance view metrics can vary based on the reporting tool used and the specific inputs or filters applied to those metrics. For example, Advertising tracks impressions and clicks to evaluate the efficacy of an ad taking the shopper to the shelf (that is, all detail page views). On the other hand, Brand Analytics tracks customer traffic to a detail page where the vendor has had the opportunity to convert a sale (that is, has the featured offer on the product detail page). Since the denominator may be different depending on the user’s use case, glance view metrics may vary across different tools.
Using glance views to calculate conversion
Conversion is the percentage of times a glance view was converted into a sale. It is a derived metric that is calculated by dividing ordered revenue by glance views.
Which Information is Provided on the Retail Analytics Catalog Dashboard?
The Catalog dashboard lets you monitor catalog quality by instantly accessing the latest catalog details for your products.
Critical KPIs to review:
|
KPI |
Definition |
|
Product Group |
A collection of related products that share similar characteristics, such as category, brand, or features |
|
Replenishment Category |
A classification of products based on their replenishment frequency and lead times. |
|
Prep Instructions Required |
Indicates whether specific preparation or handling instructions are necessary for a product before it can be shipped or sold. |
|
Prep Instructions Vendor Status |
The status of the vendor's compliance with the required preparation instructions. |
Accessing the Catalog dashboard
This dashboard is available to all vendors and users with access to ARA regardless of additional permissions. Vendors will have access to select the “Manufacturing” view in addition to the “Sourcing” view only if the vendor is a manufacturer. Enabling or disabling this view will be owned by retail stakeholders. Reach out to your retail partners if you believe you should have access to the Manufacturing view or open a “Contact Us” case.
Why only some people see the “Manufacturing view” in the Catalog dashboard, while others can’t?
All users will have access to the “Sourcing” view option if they have access to ARA. Users who are not administrators must have the "Financial Reports" task-based role enabled in order to access the “Manufacturing” view of the Catalog dashboard. Admins will already have all rights enabled by default. Only an admin can enable or disable a non-admin’s rights.
Catalog dashboard update frequency
The report will update with the most recent available ASIN attribute data and display to the user the most recent date the report was updated. There is no date selection available.
Need Help with Understanding Amazon Retail Analytics? Connect with us at Be Bold Digital Today!
Are you struggling to make sense of the vast amount of data available in Amazon Retail Analytics? Our team of experts at Be Bold Digital can help you unlock the full potential of this powerful tool. We offer comprehensive services to help you understand and leverage Amazon Retail Analytics data.
Don't let valuable data go to waste. Contact Be Bold Digital today to learn more about how we can help you harness the power of Amazon Retail Analytics and drive your business forward.

Alt text: FREE 14-Day-Trial of beBOLD Analytics for Amazon Vendor & Seller, Walmart >>
Conclusion
We've explored the power of Amazon Retail Analytics and how it can be a valuable tool for sellers looking to optimize their business performance. By understanding and utilizing the data provided by ARA, you can gain valuable insights into customer behavior, product performance, and market trends.
Now, it's time for you to take action! Start exploring ARA and begin leveraging its capabilities to drive your business forward.
Vendor Retail Analytics FAQs
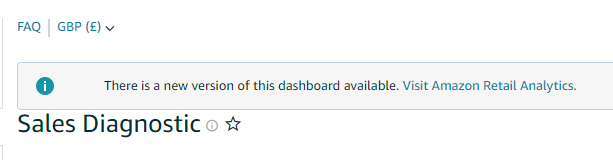
How do I find the New Amazon Retail Analytics?
New Amazon Retail Analytics Dashboards are now available in Amazon Vendor accounts. Brand Analytics Dashboards that will direct you to the new ARA dashboards. Reports > Brand Analytics > (link to top of page) There is a new version of this dashboard available. Visit Amazon Retail Analytics.
What key metrics should vendors track in Retail Analytics?
Key metrics for vendors to track in Retail Analytics include sales performance, inventory levels, customer behavior, pricing effectiveness, and marketing performance. By monitoring these metrics, vendors can gain valuable insights into their business operations, identify areas for improvement, and make data-driven decisions to optimize their performance.
Is Amazon Retail Analytics free?
Short Answer - Yes. The most strategic change in 2020 to Amazon Brand Analytics was that it became free for brand owners (making data available similar to the Seller platform). The caveat to this is the brand must be registered through the brand registry in order to not be charged for this reporting, which used to be around 1% of retail sales.
What is Vendor Retail Analytics, and how does it benefit suppliers?
Vendor Retail Analytics provides suppliers with valuable data and insights into their performance on retail platforms. By tracking metrics such as sales, inventory, customer behavior, and marketing effectiveness, vendors can make informed decisions, optimize their operations, and strengthen relationships with retailers. This ultimately leads to improved business performance and increased profitability.
What tools and platforms are available for vendors to access Retail Analytics?
Several tools and platforms are available for vendors to access Retail Analytics data. These include retailer-provided analytics platforms, third-party analytics tools, and data integration platforms. By utilizing these resources, vendors can gain valuable insights into their retail operations and make data-driven decisions to improve their business.


Comments