



A Prime Big Deal Days performance analysis should show whether the event led to profitable growth, what helped or held back each product, and what your team should change before Black Friday and Cyber Monday.
At beBOLD Digital, we recommend reviewing financial, advertising, retail, and inventory results together. Advertising reports show campaign efficiency, but they do not explain every operational or financial challenge.
Our Amazon account management approach helps teams connect these decisions. Follow the seven steps below to turn event results into a shared plan for offers, products, spending, and replenishment.
Step 1: Define the Audit Scope and Gather Comparable Data
Confirm the Event Objective and Products to Review
Start with the goal you set before the event. Did you want to increase contribution profit, introduce a gift set, attract new customers, or clear extra inventory?
Write down that objective and any financial limits. List participating ASINs, offer types, discount periods, and relevant non-promoted products. Review one marketplace at a time before combining results across markets.
Set Your Baseline, Event, and Post-Event Periods
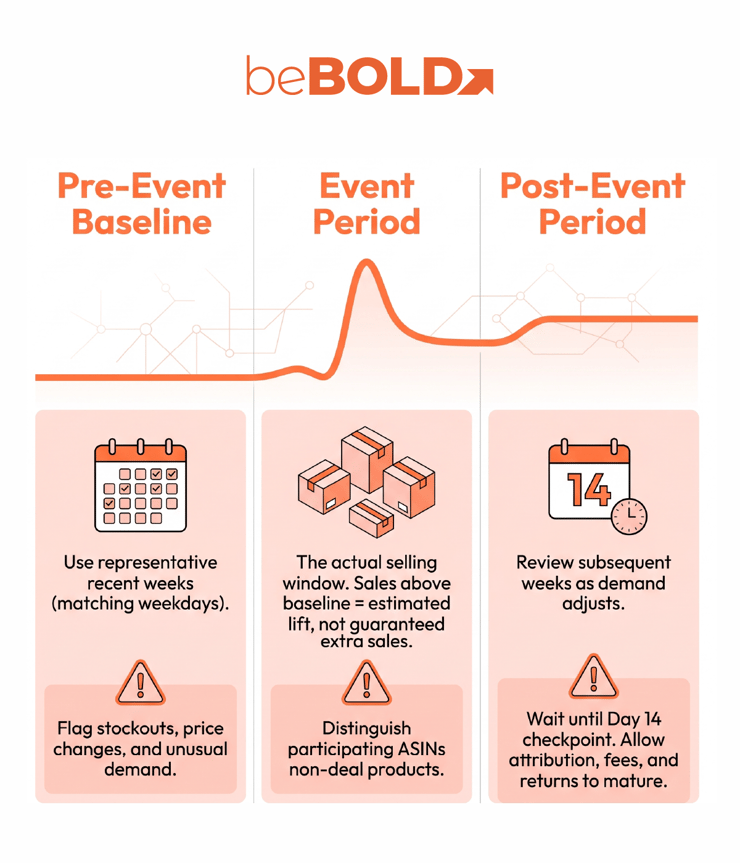
A sales increase needs a reasonable comparison. Define:
-
Pre-event baseline: Representative recent weeks, matching weekdays where practical. Flag stockouts, promotions, price changes, and unusual demand.
-
Event period: The actual selling window, identifying when each product’s offer was active.
-
Post-event period: The following weeks, showing what happened after discounts ended.
Use daily averages when periods differ in length. Last year’s October event adds context, but account for changes in assortment, pricing, event duration, and availability.
Sales above your expected baseline show estimated sales lift. They do not establish exactly what customers would have bought without the event.
Collect Reports With Consistent Definitions
Gather retail sales and traffic reports, advertising reports, inventory records, transaction data, and your own product costs. Keep currency, time zone, dates, and ASIN scope consistent. Record the export date and attribution definitions.
Our Amazon reporting and analytics services can support a shared view, but consistent definitions still matter.
Step 2: Build a Shared ASIN-Level Event Scorecard
Compare Results Against the Original Objective
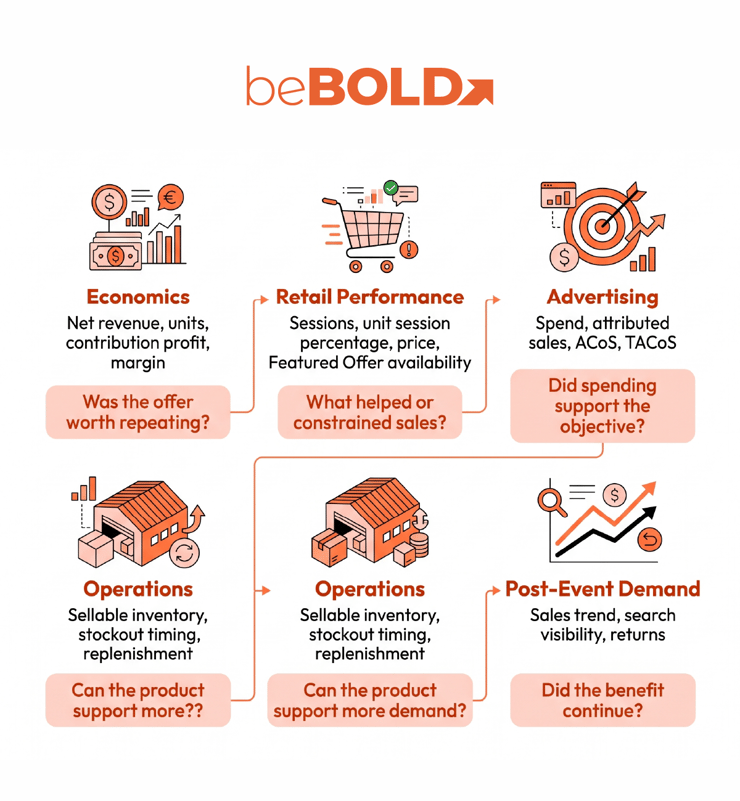
Create an account summary backed by one row per ASIN. Totals can hide a profitable bestseller alongside a discounted product that lost money.
Group the scorecard around these questions:
|
Review area |
Measures to include |
Decision it supports |
|
Economics |
Net revenue, units, contribution profit, margin |
Was the offer worth repeating? |
|
Retail performance |
Sessions, unit session percentage, price, Featured Offer availability |
What helped or constrained sales? |
|
Advertising |
Spend, attributed sales, ACoS, TACoS |
Did spending support the objective? |
|
Operations |
Sellable inventory, stockout timing, replenishment |
Can the product support more demand? |
|
Post-event demand |
Sales trend, search visibility, returns |
Did the benefit continue? |
Mark Incomplete Results and Schedule Updates
Label incomplete results as provisional. Add the finding, evidence, proposed action, owner, and data status to each ASIN’s record.
Address operational issues in the first few days, assess demand after the first week, and update financial conclusions as attribution, fees, and returns mature. Day 14 is a checkpoint, not an automatic final close.
This lets teams fix urgent issues without treating early estimates as settled conclusions.
Step 3: Calculate Contribution Profit and Sales Lift
.jpg?width=740&height=493&name=pexels-mikhail-nilov-8296979%20(2).jpg) Reconcile Revenue and Product Costs
Reconcile Revenue and Product Costs
Higher revenue does not always mean better economics. Calculate contribution profit the same way for the event and baseline periods.
Start with revenue after discounts and refunds, excluding sales tax. Subtract applicable costs:
-
Cost of goods sold, accounting appropriately for returned inventory.
-
Referral fees and fulfillment or shipping costs.
-
Deal and coupon fees, plus other event-related charges.
-
Advertising spend and relevant variable operating costs.
-
Return-processing or other unrecovered costs.
Do not subtract discounts or refunds twice. Agree on how to allocate shared campaign and promotional costs across products, and label estimates. Contribution profit may exclude fixed overhead, so it is not company net profit.
Compare Profit Over Equivalent Periods
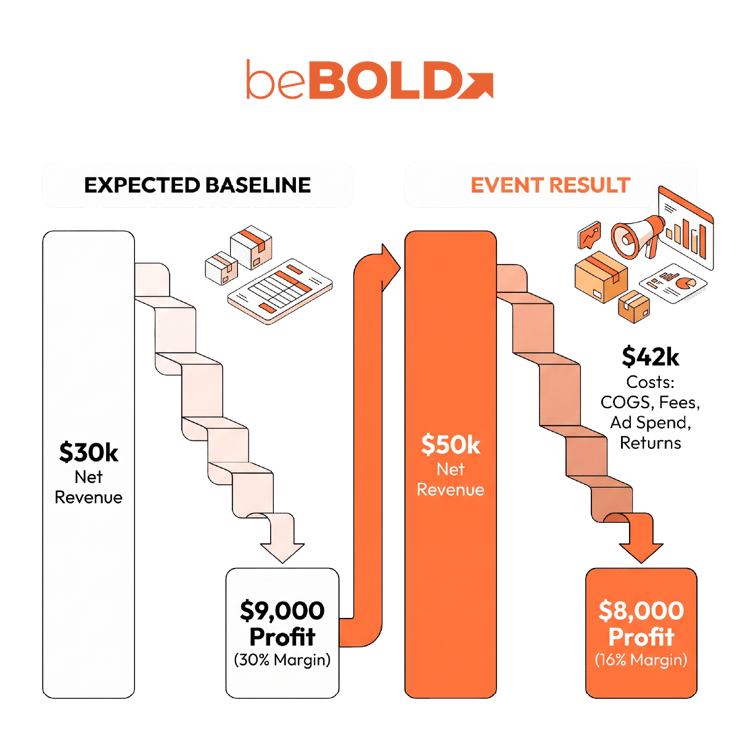
Consider this illustrative comparison for equivalent selling windows, not a client result:
|
Measure |
Expected baseline |
Event result |
|
Net revenue |
$30,000 |
$50,000 |
|
Included costs |
$21,000 |
$42,000 |
|
Contribution profit |
$9,000 |
$8,000 |
|
Contribution margin |
30% |
16% |
Estimated sales lift is event revenue minus expected baseline revenue: $20,000 in this example. Contribution margin is contribution profit divided by net revenue, expressed as a percentage.
Revenue increased, but contribution profit dropped by $1,000. Finance and account management should investigate discount depth, advertising, fees, and product mix before repeating the offer.
If event profit already includes promotional costs, do not subtract them again when comparing it with baseline profit. Later, repeat the comparison across the event and post-event period; demand changes and returns may alter the result.
Step 4: Diagnose Traffic, Conversion, Offer, and Inventory Issues
.jpg?width=740&height=494&name=pexels-kampus-7857526%20(1).jpg) Identify the Performance Pattern
Identify the Performance Pattern
Once you know the result, investigate the cause. Review traffic, conversion, price, offer health, and inventory together before choosing a fix.
Seller Central’s unit session percentage relates units ordered to sessions. It is useful for comparison, but it is not identical to the percentage of individual visitors who purchased, particularly when customers order multiple units.
|
Performance pattern |
Evidence to inspect |
Teams to involve |
|
Sessions up, unit session percentage down |
Traffic relevance, price, delivery promises, listing expectations |
Advertising and catalog |
|
Sessions down, unit session percentage up |
Advertising exposure, search visibility, deal participation |
Advertising and account management |
|
Strong demand followed by a stockout |
Sellable stock, stockout timing, replenishment dates |
Operations and advertising |
|
Units up, contribution profit down |
Discount depth, product mix, fees, acquisition costs |
Finance and account management |
These patterns raise questions; they do not prove causes. Higher traffic with lower conversion could reflect broader audiences, a less competitive offer, or an unavailable variant.
Check Offer Availability and Stockout Timing
Confirm when products were buyable, whether your offer was competitive, and when stock became unavailable. Check sellable stock against forecast demand and replenishment timing. Separate weak demand from sales constrained by availability.
Our premium beauty brand case study shows why these checks matter. The account faced competing discounted offers, incorrect titles and sizes, outdated packaging images, and advertising that benefited third-party sellers. We addressed seller control and content together.
That was a broader account engagement, not an event analysis. The lesson is to inspect the offer and listing before assuming targeting caused poor results.
Apply Beauty-Specific Checks
For beauty brands, we recommend:
-
Separating product roles: Gift sets, replenishable essentials, and trial products may show different demand after a promotion.
-
Checking child ASINs: Parent-level results can hide a shade, scent, or size with weak margins or frequent returns.
-
Reviewing customer feedback: Route packaging, quantity, application, or benefit mismatches to the catalog, creative, or product team.
More traffic will not resolve unclear expectations.
Step 5: Review Advertising Against Product Economics
Interpret ACoS and TACoS Alongside Retail Results
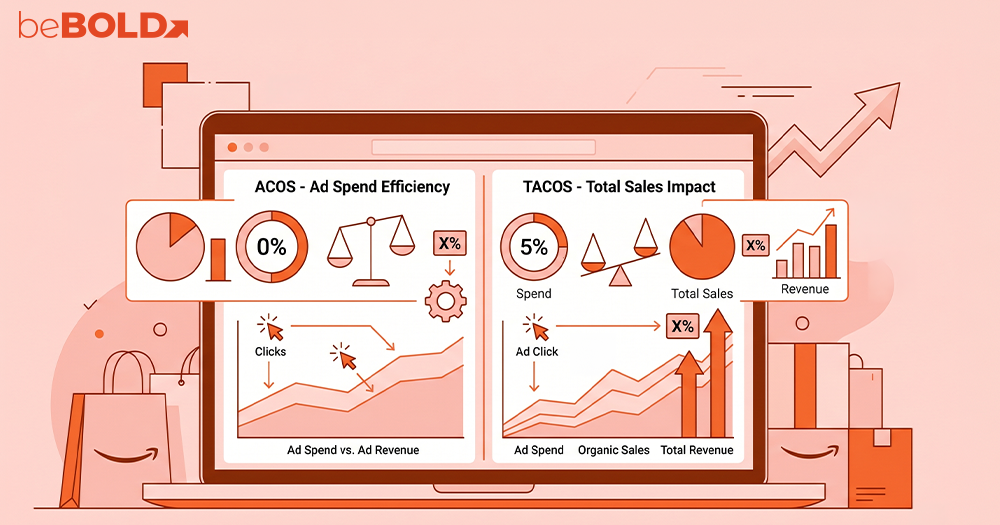
Advertising cost of sales (ACoS) compares ad spend with ad-attributed sales. Total advertising cost of sales (TACoS) compares ad spend with total retail sales. Read both alongside contribution profit and inventory.
Lower TACoS does not prove organic growth; reducing spend can also lower the ratio. Do not calculate organic sales by subtracting ad-attributed sales from retail sales when attribution windows, dates, or product scope differ.
In our Henkel Professional Beauty case study, advertising analysis supported listing improvements and ongoing strategic reviews. Published results include 30% revenue growth with 34% lower ad spend.
Reset Spending Based on Current Conditions
Adjust spending according to current conversion, margins, advertising costs, and stock. Avoid applying the same bid reduction to every campaign or automatically expanding spend on a product that cannot replenish in time.
For campaign-level investigation, use our guide to analyze Amazon PPC data.
Step 6: Check Whether Demand Continued After the Event
Compare Post-Event Sales With Your Baseline
Continue reviewing daily sales after event pricing ends. Note changes in price, advertising, availability, and delivery promises.
If demand stays higher, check whether the improvement lasts at regular pricing and sustainable advertising levels. If sales fall, investigate before concluding that shoppers simply bought early. Stockouts or reduced visibility may also explain the decline.
A discounted shampoo can encourage customers to stock up, changing when they reorder. A gift set may face different demand after the event. Neither pattern alone proves lasting customer acquisition.
Separate Search Visibility From Customer Retention
Check tracked keyword positions, relevant search activity, purchase share, returns, and repeat buying.
Track Best Sellers Rank separately from keyword positions. Amazon defines BSR as category sales performance, not rank for a particular search term.
Where available, Brand Analytics supports search and repeat-purchase analysis. Search Query Performance includes organic and Sponsored Products search activity, so it is not an organic-only report.
Similarly, new-to-brand purchases identify customers without a brand purchase in the preceding 12 months, not guaranteed future loyalty. Assess repeat buying over a realistic replenishment cycle; two weeks may be too soon for full-size haircare products.
Step 7: Assign Q4 Actions and Verify Completion
Decide What to Repeat, Revise, Hold, or Exclude
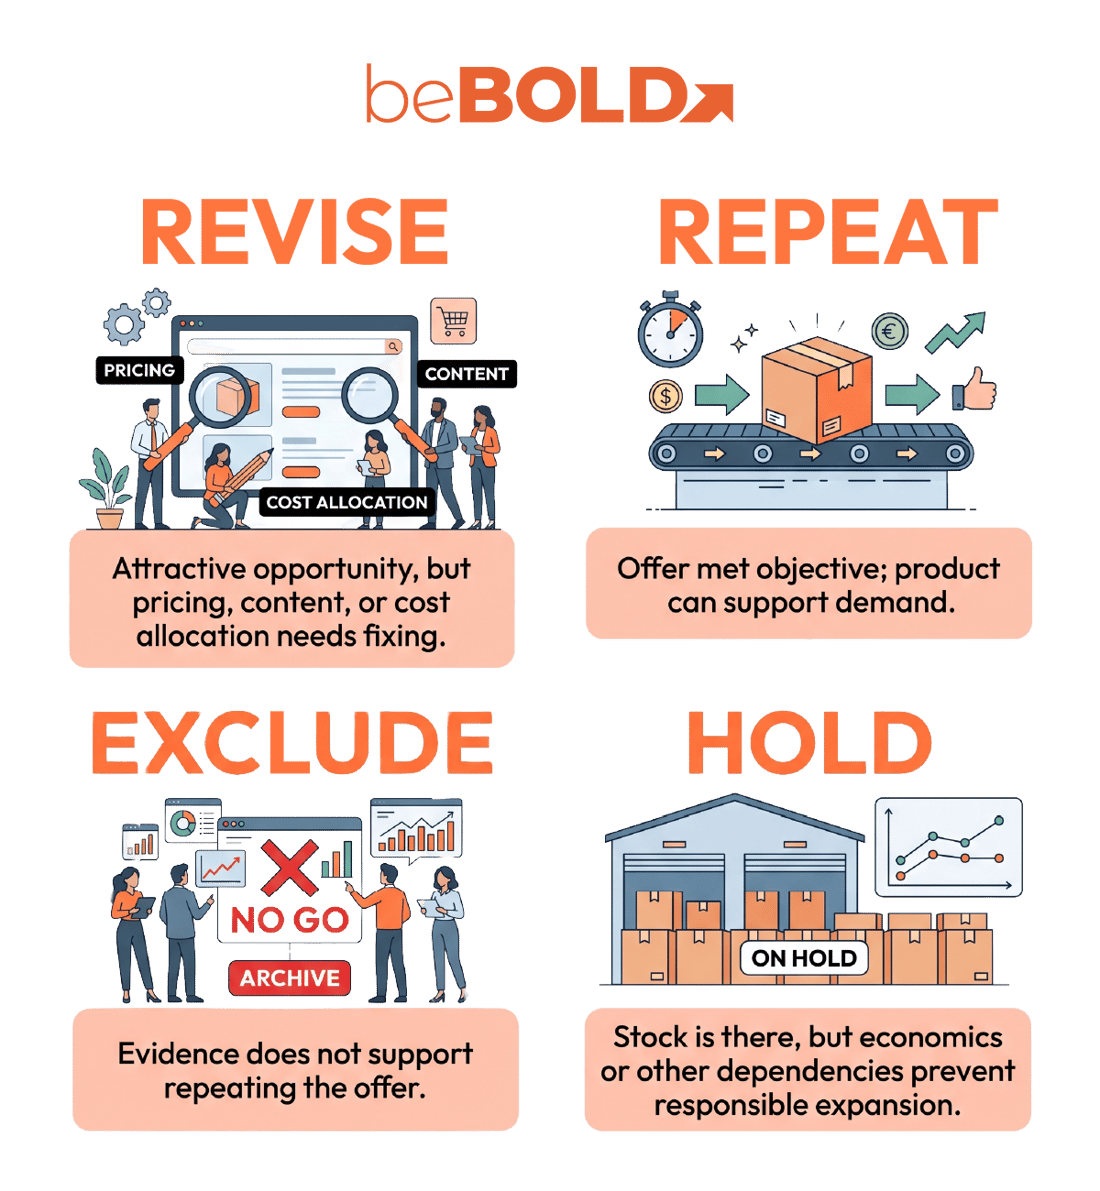
Your post-event performance analysis should end with decisions about products, offers, spending, and readiness. We recommend four categories:
-
Repeat: The offer met its objective within acceptable economics, and the product can support further demand.
-
Revise: The opportunity remains attractive, but pricing, content, targeting, or costs need attention.
-
Hold until ready: Stock, offer availability, or another dependency prevents expansion.
-
Exclude from the next promotion: The evidence does not support repeating the offer on acceptable terms.
Use your brand’s margin and inventory requirements. Strong sales should not override an unresolved stock issue.
Record Evidence, Owners, and Deadlines
Make each action specific enough to implement and verify. These examples are illustrative:
|
Finding |
Supporting evidence |
Action |
Owner |
Due |
Verification |
|
Units rose but profit fell |
Reconciled ASIN cost comparison |
Revise offer economics |
Finance and account management |
Before deal submission |
Offer meets agreed margin floor |
|
Profitable ASIN sold out |
Stockout record and inbound plan |
Confirm replenishment before scaling |
Operations |
Before budget approval |
Stock is sellable and cover is adequate |
|
Traffic rose but conversion fell |
Session trend and offer review |
Investigate listing and traffic relevance |
Catalog and advertising |
Before creative sign-off |
Fix is live and monitored |
If several teams are involved, name one accountable person and identify who supports the work.
Sequence the Work and Check Results
Confirm sellable inventory before increasing spend, agree on offer economics before submitting a deal, and fix listing issues before driving more traffic.
Use the findings to shape your holiday PPC plan. Schedule a follow-up to verify completion and results. Keep observations separate from hypotheses so the next event tests a clear decision instead of repeating an assumption.
Build Your Next Q4 Plan With beBOLD Digital
A useful Prime Big Deal Days performance analysis gives every team a clear next step. Finance understands offer economics, advertising knows where spending makes sense, and operations can confirm which products are ready.
beBOLD Digital brings these priorities together through account management, advertising, listing optimization, and analytics. Connect with our Amazon account management team to review your event findings and build a Q4 plan focused on profitability, product readiness, and accountable execution.
 Frequently Asked Questions
Should We Review ASINs That Did Not Run a Deal?
Yes. Include them to see whether demand shifted between promoted and non-promoted products. At beBOLD Digital, we recommend checking changes in sales, advertising, and availability across the range. Non-promoted ASINs provide context, but they are not automatically a reliable control group because event conditions can affect them too.
What If We Do Not Have a Reliable Pre-Event Baseline?
Use the best available comparison, such as comparable in-stock weeks or a documented forecast, and explain its limitations. Keep observed results separate from estimated lift. If no credible baseline exists, assess the event against your objectives and contribution profit without claiming proven incremental growth.
How Can We Tell Which Change Improved Performance?
If discounts, creative, bids, and inventory changed together, the review usually cannot isolate one cause. Record what changed and when, then identify explanations to test. We recommend controlled follow-up tests where practical, rather than attributing the entire improvement to one tactic.





Comments